FIELD EXPERIENCES
Every landscape contains ecological interaction waiting to be observed.
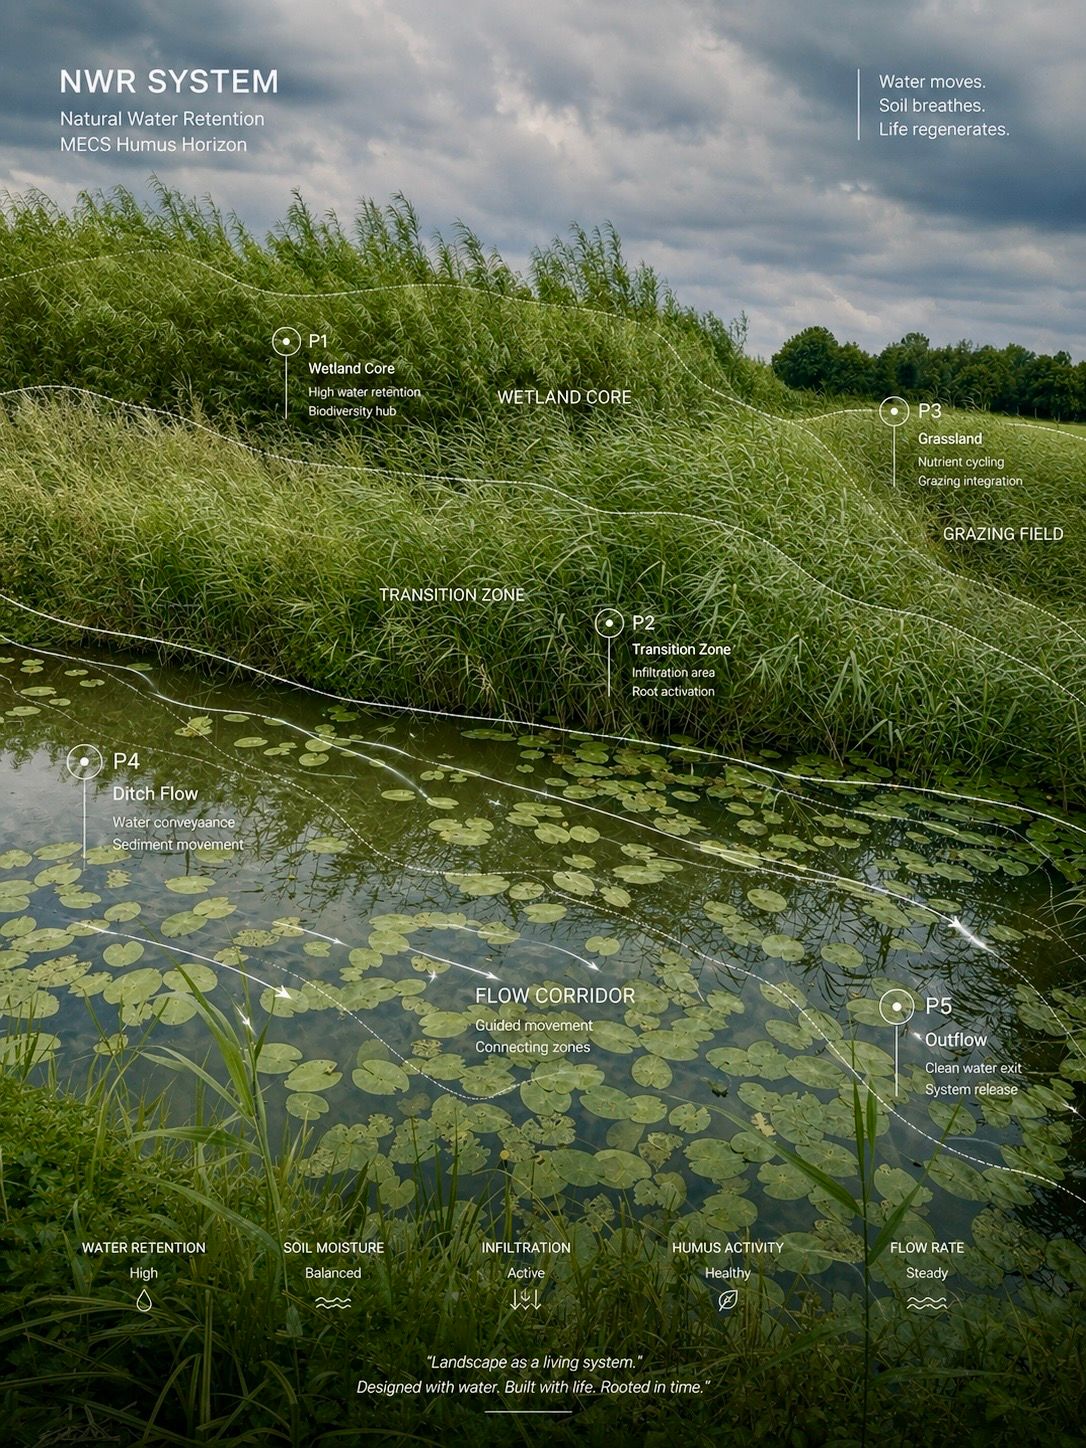
NWR SYSTEM transforms field observation into a visual and immersive landscape experience through hydrology, drone monitoring and ecological mapping.
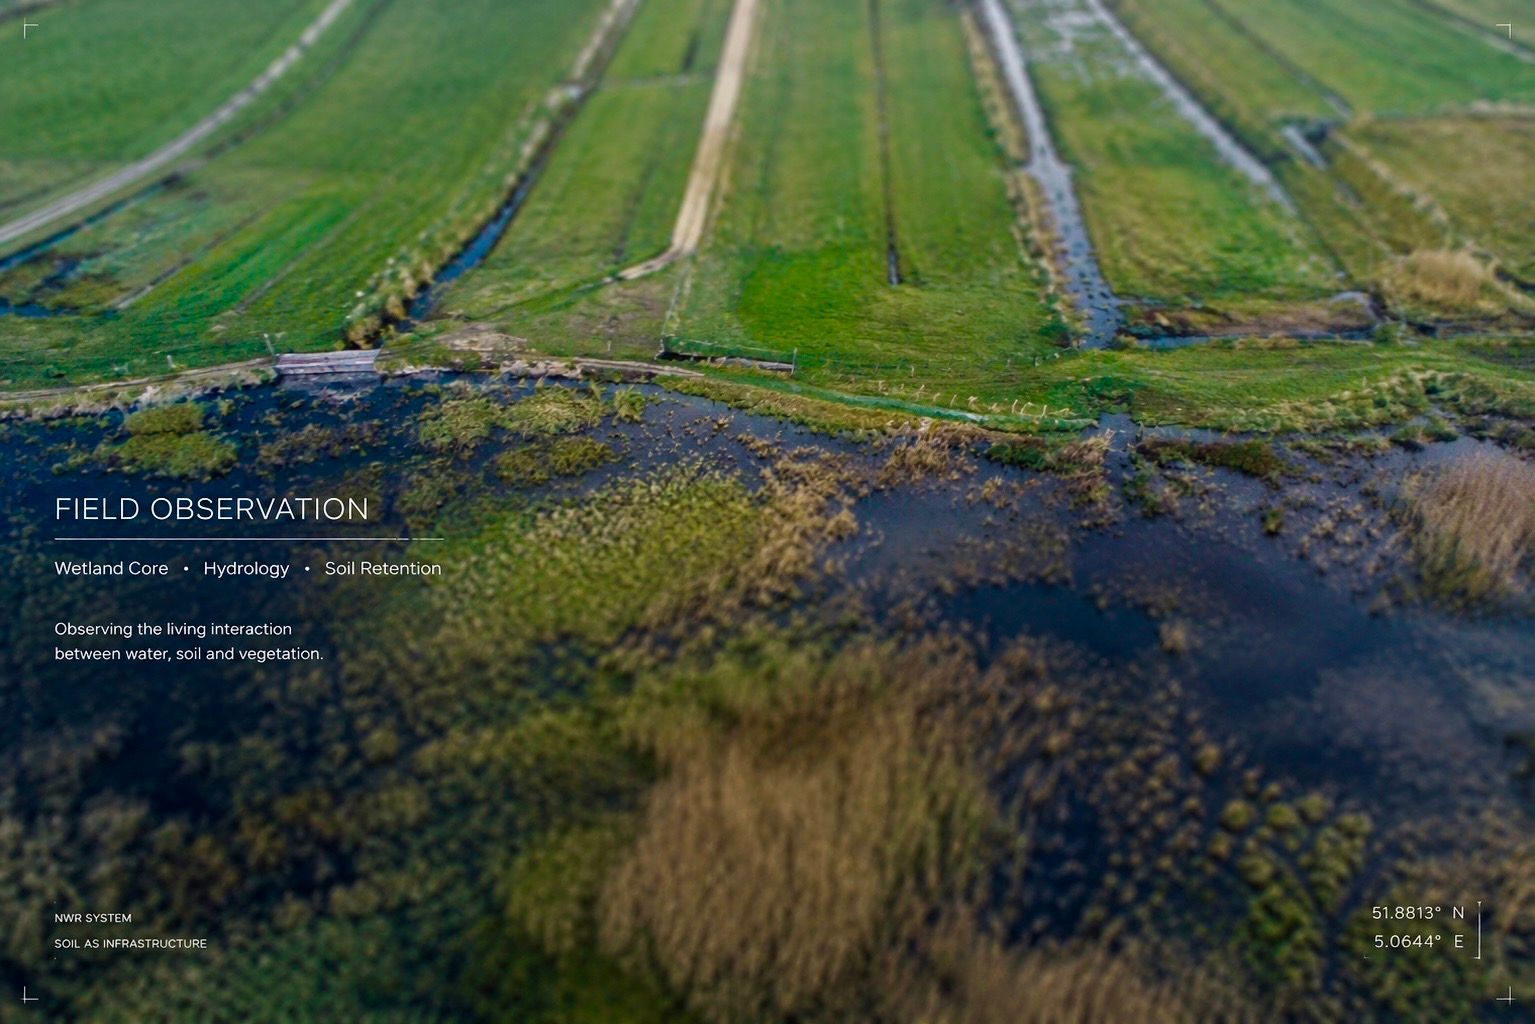
WETLAND OBSERVATION
Hydrology • Reed Systems • Water Retention
Observe how wetlands, reed zones and living soils interact to slow water movement and support infiltration across the landscape.
The Wetland Observation environments reveal:
- seasonal water dynamics
- ecological buffering
- sediment interaction
- biological activity
- and hydrological connectivity between water and soil systems.
Through field observation and landscape monitoring, wetlands become visible not as isolated nature zones, but as active ecological infrastructure within the landscape.
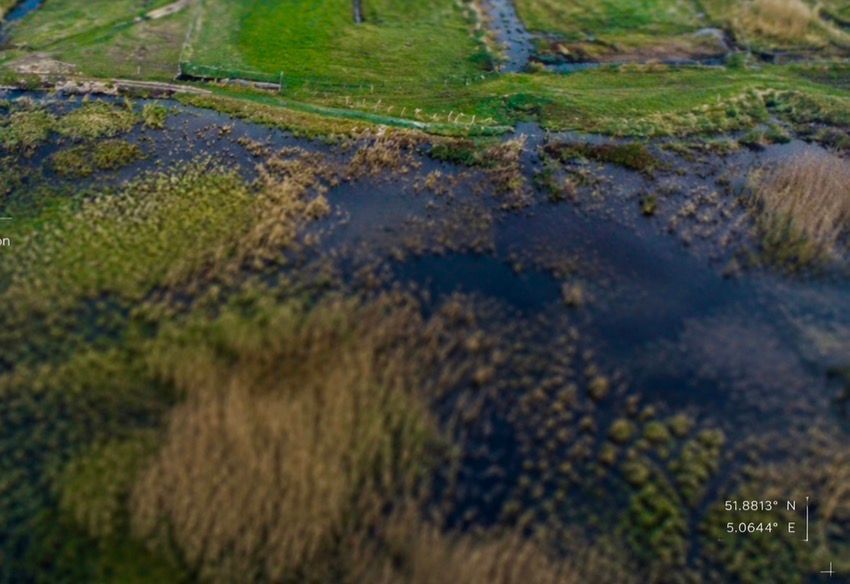
Aerial Observation • Landscape Mapping • Seasonal Change
Drone imagery reveals hydrological structures, vegetation patterns and ecological transitions throughout the pilot landscapes.
Seasonal aerial observation documents:
- water retention zones
- infiltration patterns
- grazing dynamics
- vegetation response
- and shifting landscape structures over time.
Combined with overlays and monitoring points, drone observation creates a visual understanding of how landscapes organize water movement and ecological resilience.
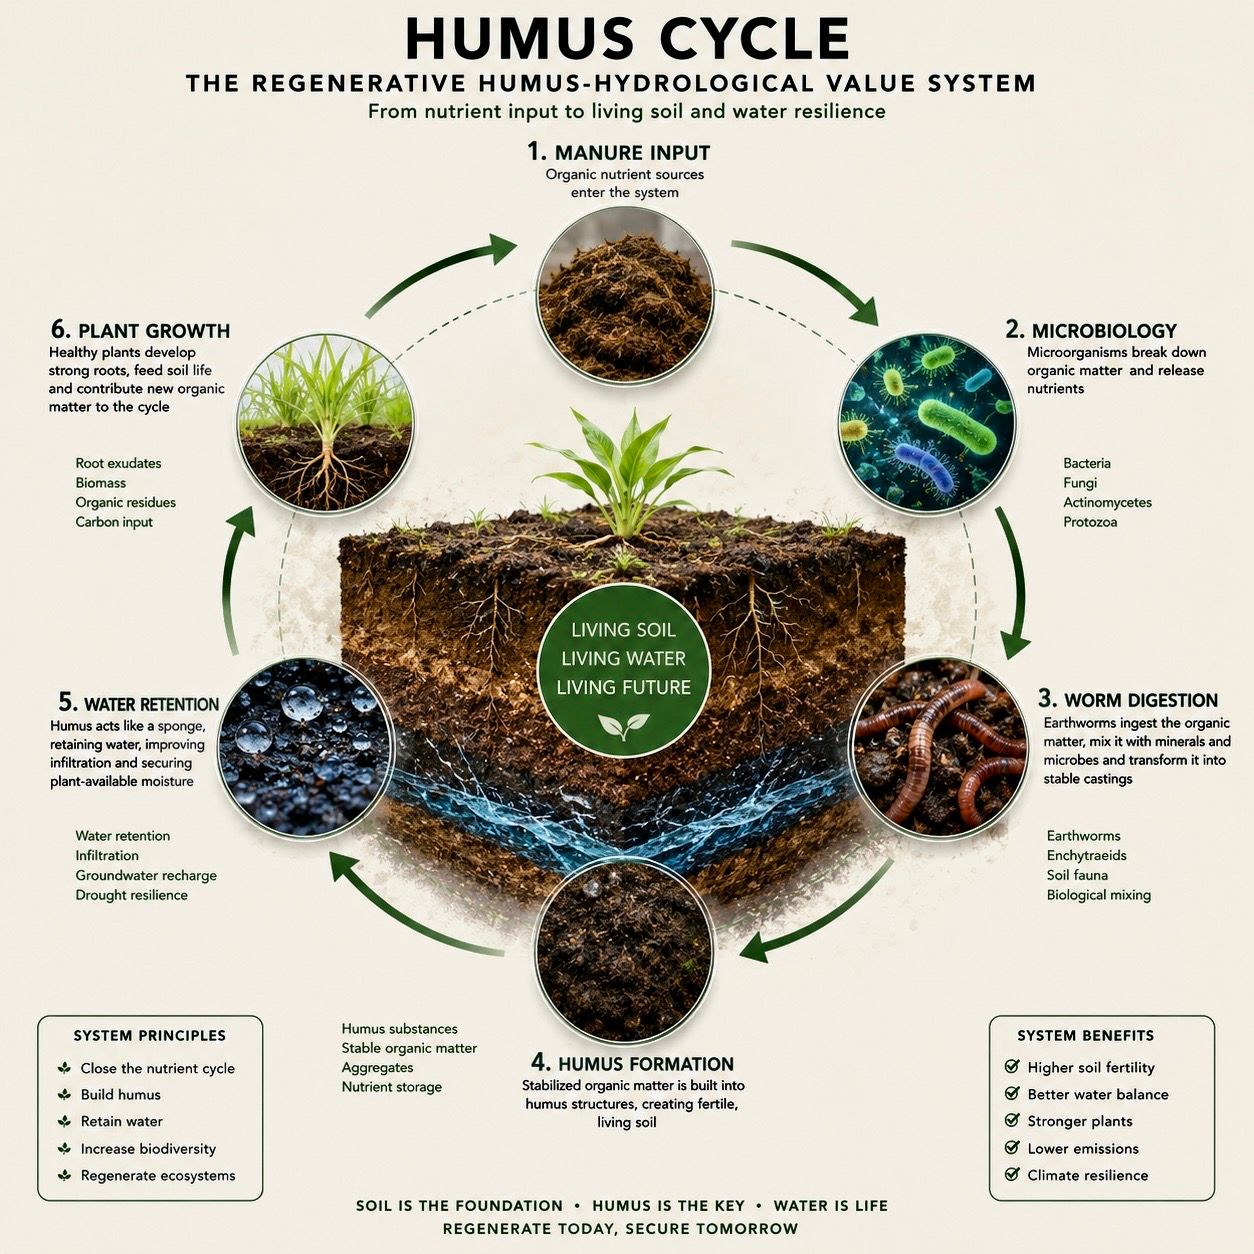
Humus • Root Structures • Biological Activity
Healthy soils function as living infrastructure beneath the landscape surface.
NWR SYSTEM studies how:
- humus formation
- root development
- microbiology
- grazing interaction
- and organic matter cycles
contribute to water buffering, infiltration and long-term ecological resilience.
These living soil systems influence not only agricultural productivity, but the carrying capacity and climate stability of the landscape itself.
ECOLOGICAL DASHBOARDS
Hydrology • Monitoring • Landscape Intelligence
Ecological dashboards translate field observation, drone imagery and hydrological monitoring into visual landscape intelligence.
Through ecological overlays, fixed monitoring points and seasonal documentation, the dashboards reveal how:
- water moves through the landscape
- soils retain moisture
- vegetation responds to hydrology
- and biological systems interact over time.
Rather than reducing landscapes to static numbers, NWR SYSTEM visualizes ecological interaction as a living and evolving process.
The dashboards function as:
- observation interfaces
- hydrological field records
- ecological monitoring environments
- and visual documentation of landscape resilience.
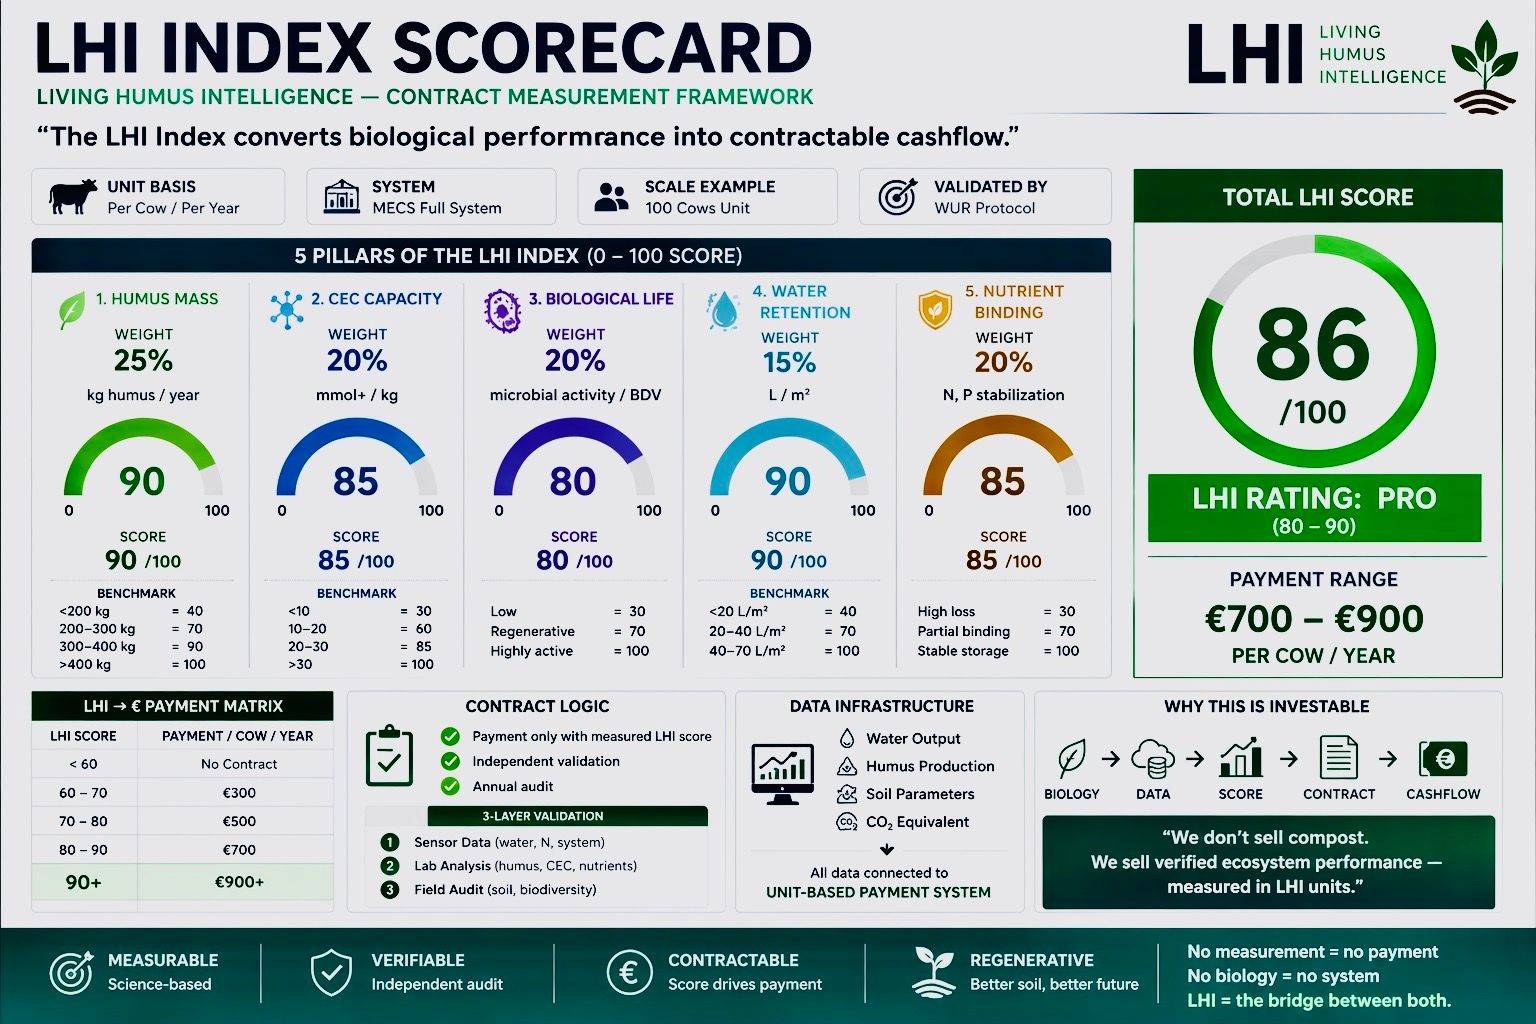
LHI- MECS Framework Dashboard
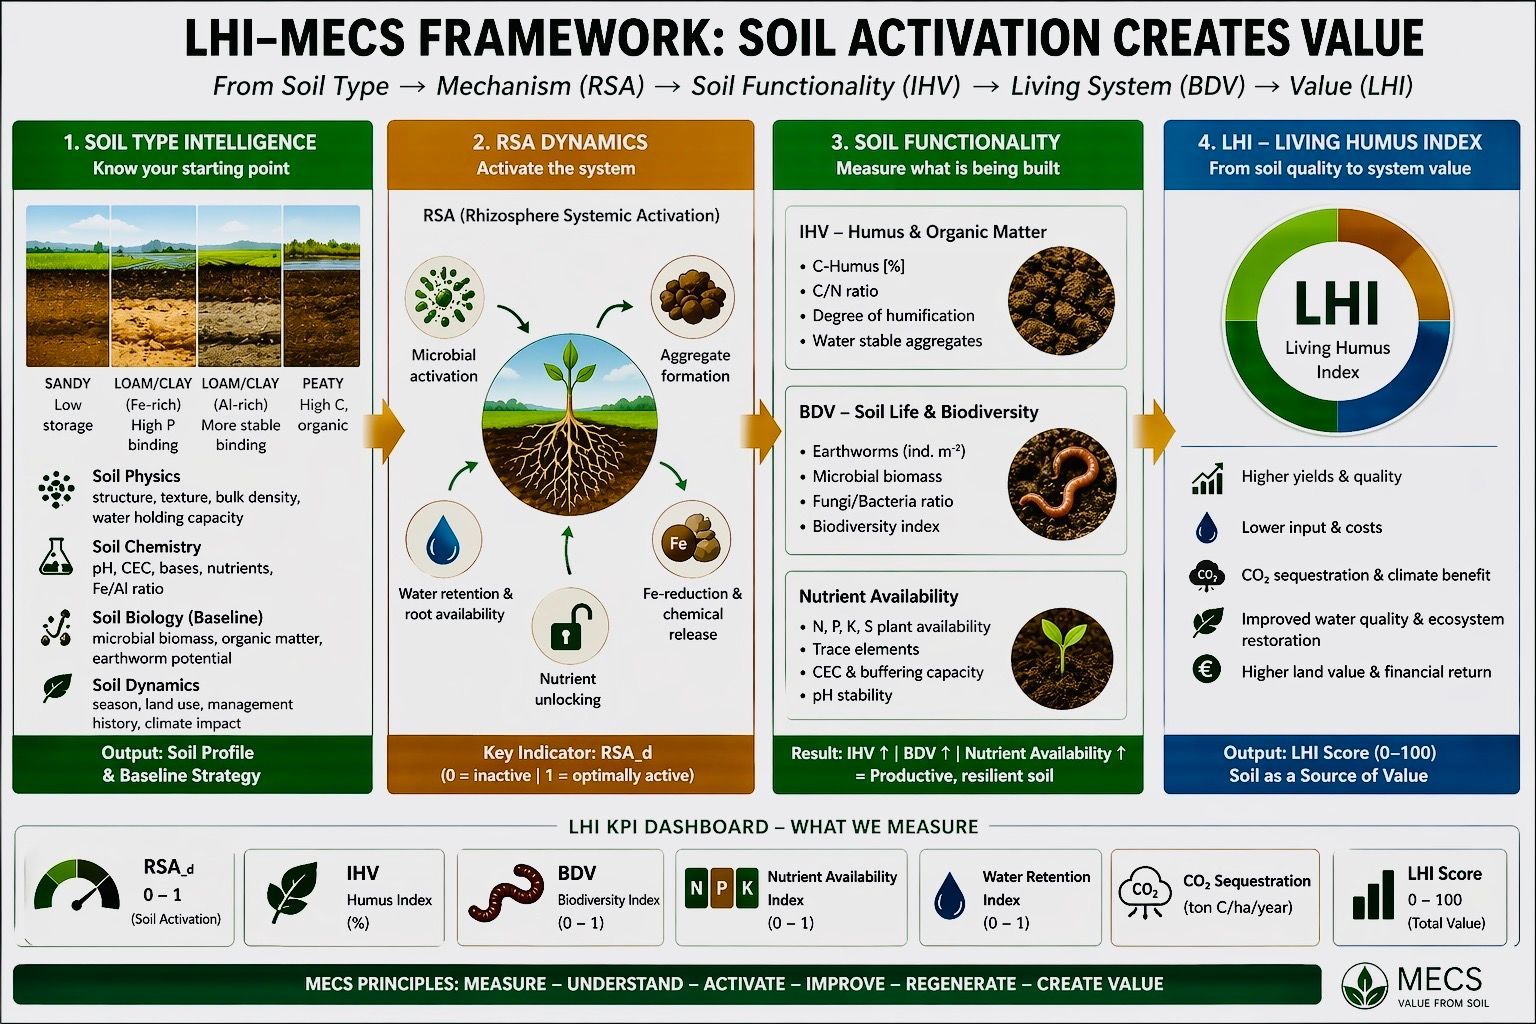
LHI- 4D LANDSCAPE INTELLIGENCE DASHBOARDS
The LHI Framework was developed by NWR SYSTEM to better understand how living landscapes respond to water, soil interaction and ecological change over time.
Rather than viewing landscapes as static surfaces, LHI approaches the environment as a dynamic and interconnected system in which hydrology, biology, soil structure and seasonal processes continuously influence one another.
The platform combines:
- field observation
- drone monitoring
- ecological overlays
- hydrological mapping
- and seasonal landscape documentation
into a visual ecological intelligence framework.
⸻
A LIVING OBSERVATION MODEL
LHI is designed as a 4D observation model.
The framework studies not only the physical structure of the landscape, but also how the landscape evolves through time, climate conditions and biological interaction.
The fourth dimension within LHI is time itself:
- rainfall cycles
- seasonal transitions
- drought response
- vegetation change
- and long-term ecological adaptation.
Rather than focusing solely on control or prediction, the model emphasizes observation, interaction and landscape resilience.
⸻
THE FOUR OBSERVATION LAYERS
1 — HYDROLOGY
Water movement shapes the landscape.
The hydrological layer observes:
- retention
- infiltration
- flow dynamics
- wetland interaction
- and seasonal water behavior across the pilot environment.
This layer visualizes how landscapes buffer and redistribute water under changing climate conditions.
⸻
2 — LIVING SOIL SYSTEMS
Healthy soils function as ecological infrastructure beneath the surface.
The soil layer focuses on:
- humus development
- soil structure
- root interaction
- microbiology
- organic matter
- and water retention capacity.
The framework studies how biological soil activity contributes to landscape resilience and long-term ecological stability.
⸻
3 — ECOLOGICAL RESPONSE
Landscapes continuously respond to hydrology and biological interaction.
The ecological layer documents:
- vegetation dynamics
- reed systems
- biodiversity interaction
- ecological connectivity
- and grazing landscape response.
This layer reveals how ecosystems adapt and reorganize through changing environmental conditions.
⸻
4 — TEMPORAL DYNAMICS
Landscapes evolve through time.
The temporal layer visualizes:
- seasonal transitions
- rainfall response
- wet and dry cycles
- ecological recovery
- and long-term landscape adaptation.
By integrating time into observation, LHI allows ecological processes to become visible as living movement rather than static data.
⸻
ECOLOGICAL FIELD INTELLIGENCE
The LHI Dashboard is not designed as a conventional technical control system.
Instead, it functions as:
- a landscape observatory
- an ecological monitoring environment
- a hydrological field intelligence platform
- and a visual documentation system for living landscapes.
Through observation, the platform seeks to better understand how landscapes themselves organize resilience through water, soil and ecological interaction.
⸻
Soil as Infrastructure.
LHI INDEX SCORECARD